Catalogue › Spreadsheets and bookkeeping prep
Build an Excel dashboard with live charts from your data
Headline figures, a live summary table and native Excel charts from your export. Add rows and it updates. PDF preview included.
From £25 for one dashboard · 1 working day
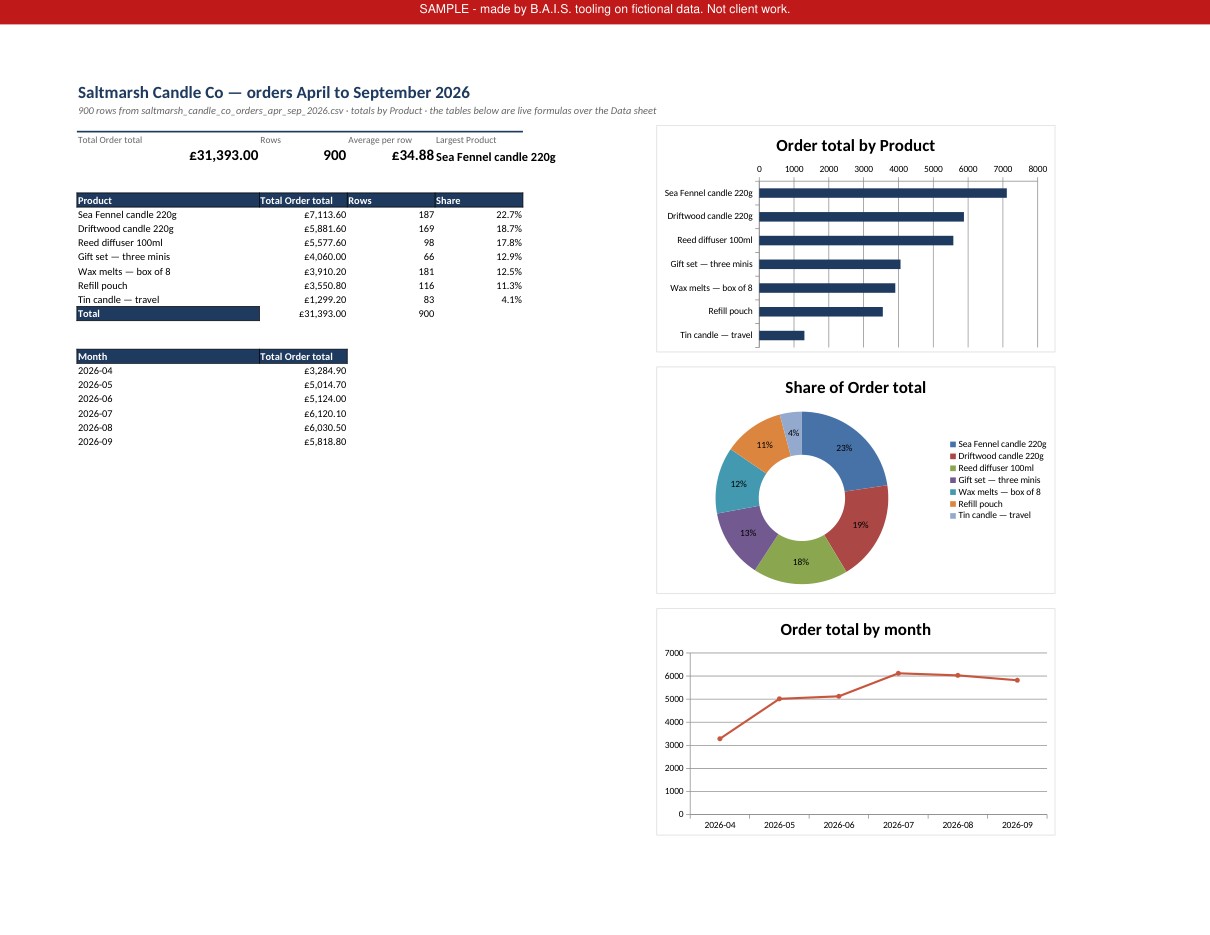
Sample shown was made on invented data — not client work. Select the picture to see the sample page full size.
- Excel workbook (.xlsx) with native charts + a one-page PDF preview.
- A fixed price and a delivery date before anything starts.
- Every result checked by a person before it goes back to you.
- Work done on our own machines — your files are not uploaded to third-party AI services — and deleted afterwards.
- A file with no numeric column.
- Pivot tables as Excel objects, slicers or macros.
- Connecting to live data sources.
six months of invented orders → an Excel workbook: a Dashboard sheet with four headline figures, a by-product table driven by SUMIFS/COUNTIFS over the Data sheet, three native charts (bar, share, monthly trend), and a one-page PDF preview.
Send it, we do it, we check it, we delete it.
Order through PeoplePerHour (its price is in £5 steps, so it can be a pound or two above the figure shown here), or email what you need with a sample of the file. If your job is not a good fit, we will tell you before you pay.
More in Spreadsheets and bookkeeping prep